2021.06.09
Learn the basics of the MediBang tone curve to adjust colours
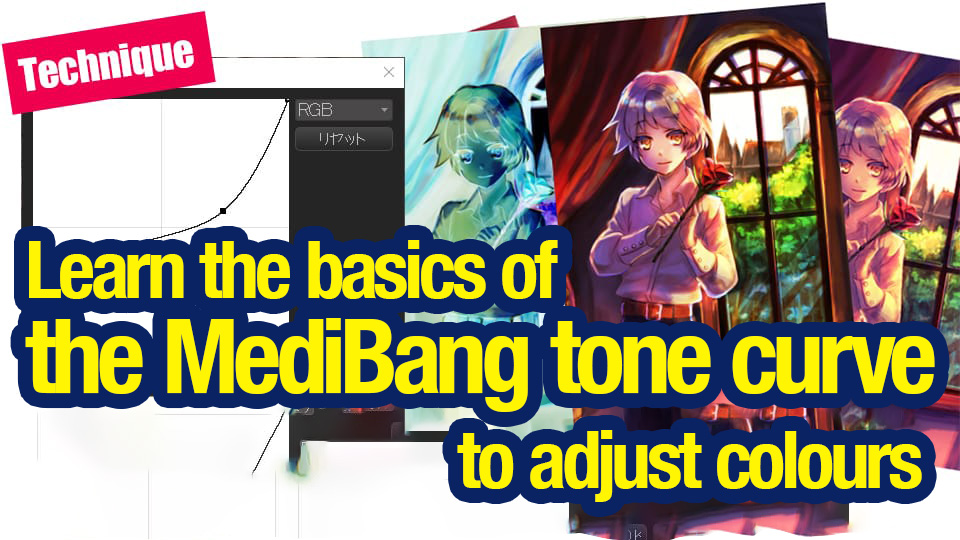

The tone curve is used to finish a picture.
It’s a great tool that allows you to make some adjustments without knowing the details of its function.
However, rather than making corrections with a vague understanding, it is better to understand the mechanism of the tone curve and make corrections to achieve the desired expression.
In this article, we will explain the mechanism of the tone curve.
What is the Tone Curve?
Tone curve is a color correction function that is used to adjust the brightness and contrast of photos and images.
Mediban Paint has a Tone Curve in the menu Filter.

When selected, a new Tone Curve window will appear.

The following image shows a larger version of the Tone Curve control screen.

The Tone Curve screen consists of two elements: (1) a rectangular area, and (2) a right shoulder tone curve.
①:Square area

②:Tone curve

In fact, the adjustment of an image depends on where within the rectangular area this right shoulder tone curve is moved to apply the correction.
Let’s look at the details below.
How to view the Tone Curve screen
The upper right (the area shown in image ① below) shows where to adjust the light areas of the image, and the lower left (the area shown in image ③ below) shows where to adjust the dark areas of the image.
And the middle (circle area in image ② below) is where you adjust the midtone brightness of the image.

In other words, if you want to correct the lightness or darkness of the bright areas of the image, you would move the tone curve in the upper right area (①).
On the other hand, if you want to correct the dark areas of the image, move the tone curve in the lower left corner (③), and if you want to change the overall brightness of the image, move the middle area (②).
How to read the vertical axis
Next, let’s take a look at how the vertical axis of the tone curve works.
The tone curve can be adjusted for lightness and darkness by moving it up and down.
Moving it up makes it lighter, and moving it down makes it darker.

As a test, I moved the middle of the tone curve up and down.

The center of the tone curve is the area that adjusts the midtone tones of the image.
By moving this area upward, we were able to brighten the image overall while maintaining the original contrast.
Conversely, moving it down will make the image darker overall.
So what happens if you move the tone curve anywhere other than the middle?
We will discuss this in the section “Typical tone curve corrections”.
How to read the horizontal axis
Next, let’s take a look at how the horizontal axis of the tone curve works.
The horizontal axis of the tone curve works in the same way as the Levels correction, allowing you to adjust the contrast and brightness between black and white in an image.
In the tone curve, the bottom left represents black and the top right represents white.
If you move the lower left tone curve to the right, you can make the black parts of the image darker and more distinct.
Conversely, if you move the upper right tone curve to the left, you can make the white areas (highlights) in the image brighter.

Levels correction is effective, for example, in correcting photo images that are hazy and white due to cloudiness or water vapor.

The image above is a white hazy picture due to cloudy weather.
By centering the two ends of the tone curve, the black areas are darkened and the white areas are lightened to create more contrast.
▼For more information on image correction using Levels Correction, click here.
Use screen layers to blend the background material with the figure illustration! .
Basic operation of Tone Curve
Let’s take a look at the basic operations of the tone curve.
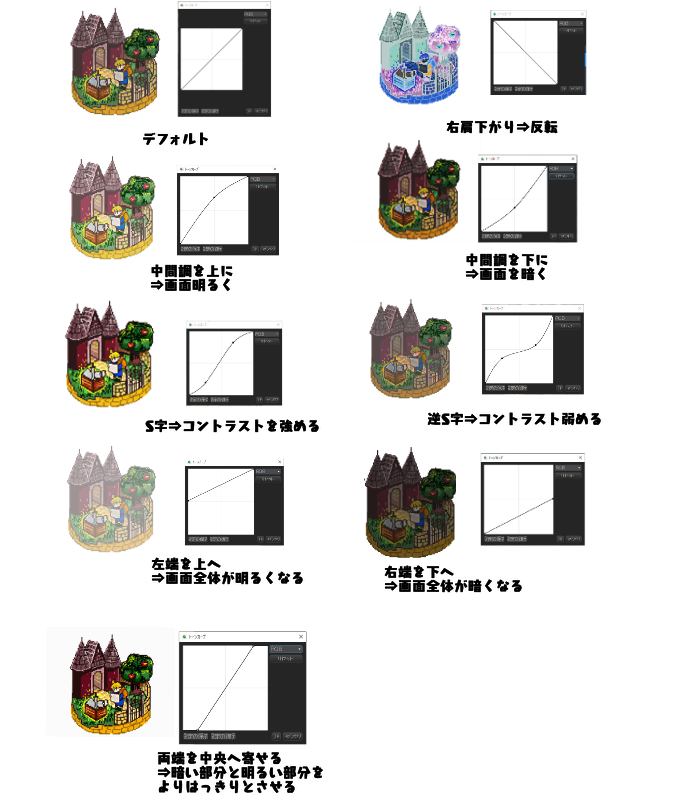
S-shape
The S-shape is often used in finishing illustrations.
It is used to increase contrast.

This is a mechanism to create contrast by making lighter areas of the image lighter and darker areas darker.

The contrast of a picture often weakens as you draw, so use an S-shaped tone curve to add strength.

Inverse S-Shape
The inverted S-shape is used to reduce the contrast.

The contrast is weakened by lowering the gradation in the light areas and raising the gradation in the dark areas.

If you compare it with a photo, you can see the change in the following image.

Left edge only raised
The following is supplementary, but if you raise only the left edge of the tone curve, the entire screen will be brighter.
This is because we are brightening the dark areas.

Let’s compare this to the case where the center of the tone curve is raised.
When the center of the tone curve is raised, the screen becomes brighter while maintaining the tones of the original image, whereas when only the left edge of the curve is raised, you can see that the contrast is no longer maintained.

Lower the right edge only
Lowering only the right edge of the tone curve will darken the entire screen without maintaining contrast.
Also, if you lower the center of the tone curve, you will see the screen darken while maintaining contrast.

Inverting the Tone Curve
Inverting the tone curve from the default right shoulder up to the opposite right shoulder down will invert the colors.

The following is a summary of each tone curve pattern.
Once you get used to it, you will be able to correct only dark or light areas of the image.
Correcting each RGB color tone in the Tone Curve
Learn how the RGB channels work
The tone curve allows you to make tonal corrections for each RGB.
R stands for red, G for green, and B for blue, and each color can be adjusted on each control screen.
RGB adjustments can be made from the pull-down menu on the tone curve screen.

R/G/B channels can be selected.

In the RGB adjustment screen, moving the tone curve to the upper left will strengthen the color of each channel displayed, and moving it to the lower right will weaken it.
For example, if you have the R channel open, moving the tone curve to the upper left will intensify the red, and moving it to the lower right will weaken it.

Let’s take a look at each of the operation screens based on the following pictures.

R
R stands for Red.
Moving the tone curve to the upper left strengthens the red, and moving it to the lower right weakens the red.
Weakening the red makes the cyan color stronger.

G
In the G control panel, moving the tone curve to the upper left strengthens the green, and moving it to the lower right weakens it.
When the green is weakened, the magenta becomes stronger.

B
In the B control screen, moving the tone curve to the upper left strengthens the blue, and moving it to the lower right weakens it.
When the blue is weakened, the yellow becomes stronger.

Know the relationship between complementary colors
Why do we get cyan, magenta, and yellow when we weaken each RGB tone curve?
It’s because of the complementary color relationship.
There are two main types of color: the three primary colors of light (RGB), which you see on LCD screens, and the three primary colors of color (CMY), which you see in printed materials.
However, in both principles, the complementary color relationship is the same.

Therefore, in the tone curve, if you weaken one of the colors, the color that is the complementary color relationship will come out stronger.
Let’s try to get the correction you want
We have now seen how the Tone Curve works.
To summarize briefly, the following two points are important.
- When you want to change the lightness or darkness of a bright part of the picture, move the tone curve in the upper right area
- When you want to change the lightness or darkness of a dark part of the picture, move the tone curve in the lower left area
However, if you tweak the tone curve too much, the tones of the original image will be lost and the image will look strange.
Let’s try to adjust the tone curve while keeping a good balance.

You can also use the RGB correction of the tone curve to make the image below have more of a sunset glow to it.

I added yellows and reds to the light areas and more blue to the dark areas.

You can also add a variety of other effects, such as horror-taste colors.
I hope you will try to use the Tone Curve to your advantage!
The above is an explanation of how Tone Curve works.
(Text and pictures by Setsu Yoshida)
\ We are accepting requests for articles on how to use /

